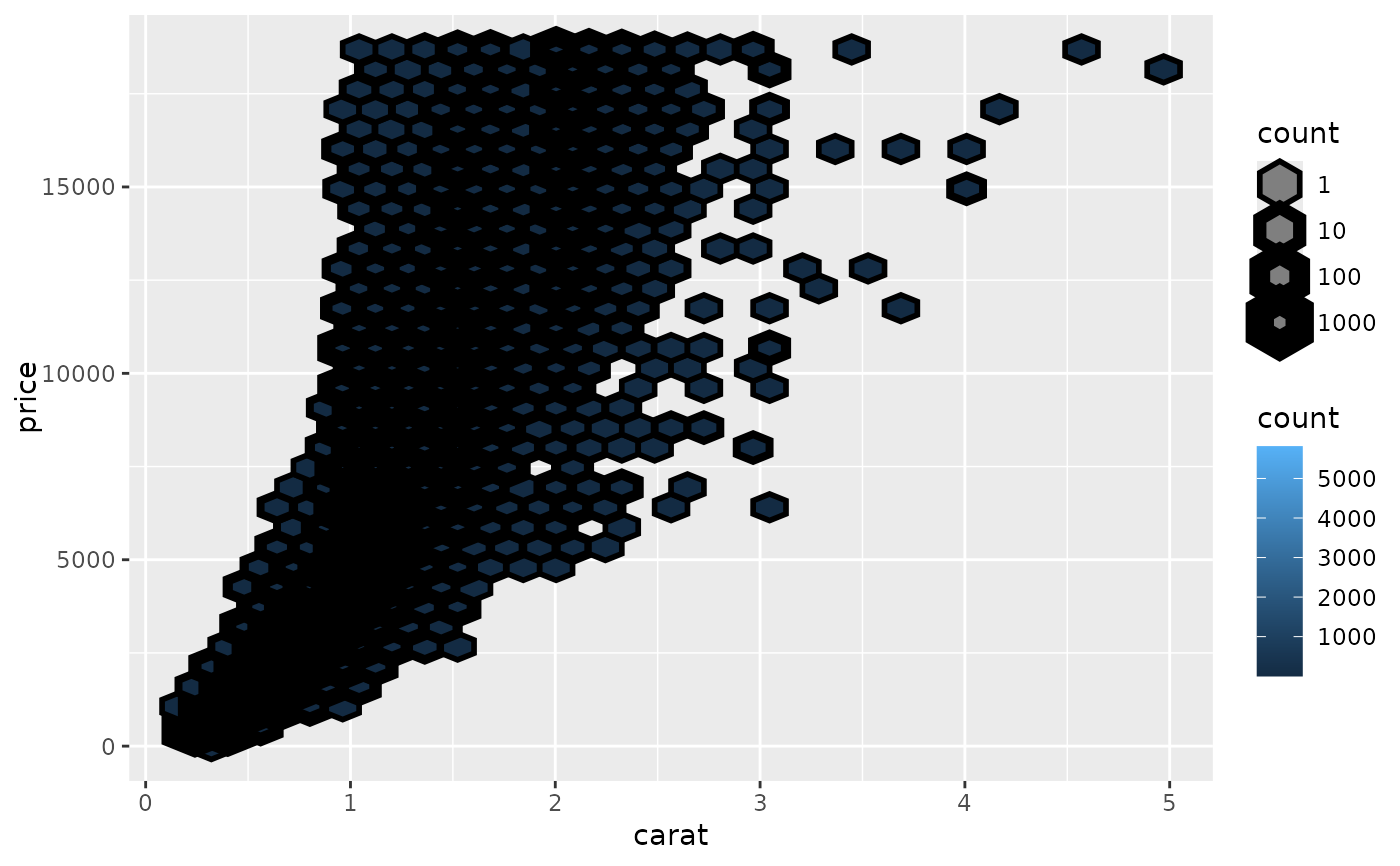
Each geom has an associated function that draws the key when the geom needs
to be displayed in a legend. These functions are called draw_key_*(), where *
stands for the name of the respective key glyph. The key glyphs can be
customized for individual geoms by providing a geom with the key_glyph
argument (see ggplot2::layer() or examples below.)
Examples
library(ggplot2)
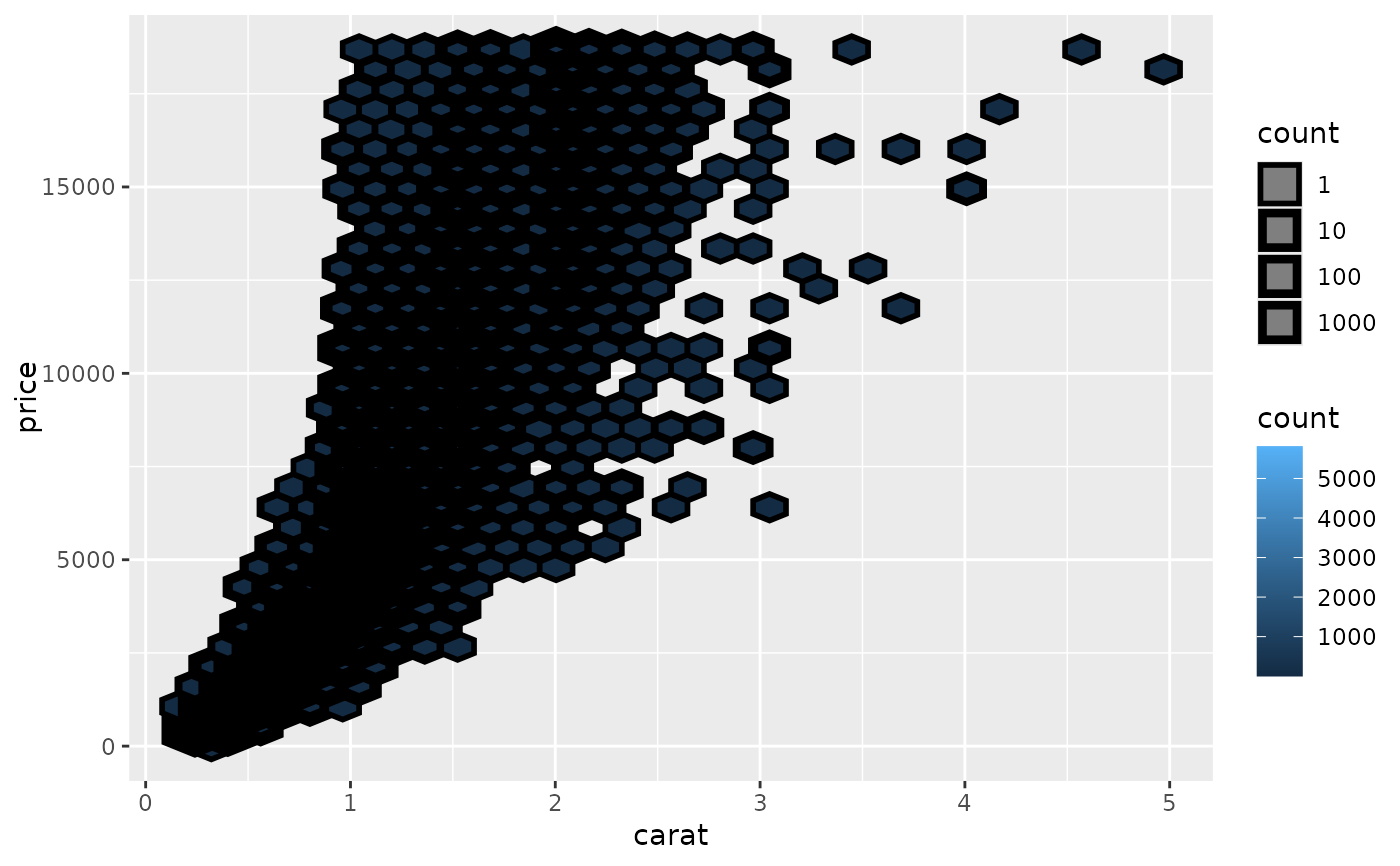
d <- ggplot(diamonds, aes(carat, price, linewidth = after_stat(count))) +
scale_linewidth(trans = "log10")
d + geom_hex(colour = "black")
 # key glyphs can be specified by their name
d + geom_hex(colour = "black", key_glyph = "hextile")
# key glyphs can be specified by their name
d + geom_hex(colour = "black", key_glyph = "hextile")
 # key glyphs can be specified via their drawing function
d + geom_hex(colour = "black", key_glyph = draw_key_hextile)
# key glyphs can be specified via their drawing function
d + geom_hex(colour = "black", key_glyph = draw_key_hextile)
