Scales to map continuous x or y data values onto the fill aesthetic,
producing a gradient fill along the respective axis.
Usage
scale_fill_x(
  ...,
  type = getOption("ggplot2.continuous.fill"),
  n.colours = 500,
  stops = seq(0, 1, length.out = n.colours),
  na.rm = FALSE,
  group = TRUE,
  bounding.aes = NULL
)

scale_fill_y(
  ...,
  type = getOption("ggplot2.continuous.fill"),
  n.colours = 500,
  stops = seq(0, 1, length.out = n.colours),
  na.rm = FALSE,
  group = TRUE,
  bounding.aes = NULL
)

scale_fill_x_continuous(
  ...,
  type = getOption("ggplot2.continuous.fill"),
  n.colours = 500,
  stops = seq(0, 1, length.out = n.colours),
  na.rm = FALSE,
  group = TRUE,
  bounding.aes = NULL
)

scale_fill_y_continuous(
  ...,
  type = getOption("ggplot2.continuous.fill"),
  n.colours = 500,
  stops = seq(0, 1, length.out = n.colours),
  na.rm = FALSE,
  group = TRUE,
  bounding.aes = NULL
)

scale_fill_x_binned(
  ...,
  type = getOption("ggplot2.binned.fill"),
  n.colours = 500,
  stops = seq(0, 1, length.out = n.colours),
  na.rm = FALSE,
  group = TRUE,
  bounding.aes = NULL
)

scale_fill_y_binned(
  ...,
  type = getOption("ggplot2.binned.fill"),
  n.colours = 500,
  stops = seq(0, 1, length.out = n.colours),
  na.rm = FALSE,
  group = TRUE,
  bounding.aes = NULL
)

scale_fill_x_date(
  ...,
  n.colours = 500,
  stops = seq(0, 1, length.out = n.colours),
  na.rm = FALSE,
  group = TRUE,
  bounding.aes = NULL
)

scale_fill_y_date(
  ...,
  n.colours = 500,
  stops = seq(0, 1, length.out = n.colours),
  na.rm = FALSE,
  group = TRUE,
  bounding.aes = NULL
)

scale_fill_x_datetime(
  ...,
  n.colours = 500,
  stops = seq(0, 1, length.out = n.colours),
  na.rm = FALSE,
  group = TRUE,
  bounding.aes = NULL
)

scale_fill_y_datetime(
  ...,
  n.colours = 500,
  stops = seq(0, 1, length.out = n.colours),
  na.rm = FALSE,
  group = TRUE,
  bounding.aes = NULL
)

scale_fill_x_fermenter(
  ...,
  n.colours = 500,
  stops = seq(0, 1, length.out = n.colours),
  na.rm = FALSE,
  group = TRUE,
  bounding.aes = NULL
)

scale_fill_y_fermenter(
  ...,
  n.colours = 500,
  stops = seq(0, 1, length.out = n.colours),
  na.rm = FALSE,
  group = TRUE,
  bounding.aes = NULL
)

scale_fill_x_distiller(
  ...,
  n.colours = 500,
  stops = seq(0, 1, length.out = n.colours),
  na.rm = FALSE,
  group = TRUE,
  bounding.aes = NULL
)

scale_fill_y_distiller(
  ...,
  n.colours = 500,
  stops = seq(0, 1, length.out = n.colours),
  na.rm = FALSE,
  group = TRUE,
  bounding.aes = NULL
)

scale_fill_x_gradient(
  ...,
  n.colours = 500,
  stops = seq(0, 1, length.out = n.colours),
  na.rm = FALSE,
  group = TRUE,
  bounding.aes = NULL
)

scale_fill_y_gradient(
  ...,
  n.colours = 500,
  stops = seq(0, 1, length.out = n.colours),
  na.rm = FALSE,
  group = TRUE,
  bounding.aes = NULL
)

scale_fill_x_gradient2(
  ...,
  n.colours = 500,
  stops = seq(0, 1, length.out = n.colours),
  na.rm = FALSE,
  group = TRUE,
  bounding.aes = NULL
)

scale_fill_y_gradient2(
  ...,
  n.colours = 500,
  stops = seq(0, 1, length.out = n.colours),
  na.rm = FALSE,
  group = TRUE,
  bounding.aes = NULL
)

scale_fill_x_gradientn(
  ...,
  n.colours = 500,
  stops = seq(0, 1, length.out = n.colours),
  na.rm = FALSE,
  group = TRUE,
  bounding.aes = NULL
)

scale_fill_y_gradientn(
  ...,
  n.colours = 500,
  stops = seq(0, 1, length.out = n.colours),
  na.rm = FALSE,
  group = TRUE,
  bounding.aes = NULL
)

scale_fill_x_steps(
  ...,
  n.colours = 500,
  stops = seq(0, 1, length.out = n.colours),
  na.rm = FALSE,
  group = TRUE,
  bounding.aes = NULL
)

scale_fill_y_steps(
  ...,
  n.colours = 500,
  stops = seq(0, 1, length.out = n.colours),
  na.rm = FALSE,
  group = TRUE,
  bounding.aes = NULL
)

scale_fill_x_steps2(
  ...,
  n.colours = 500,
  stops = seq(0, 1, length.out = n.colours),
  na.rm = FALSE,
  group = TRUE,
  bounding.aes = NULL
)

scale_fill_y_steps2(
  ...,
  n.colours = 500,
  stops = seq(0, 1, length.out = n.colours),
  na.rm = FALSE,
  group = TRUE,
  bounding.aes = NULL
)

scale_fill_x_stepsn(
  ...,
  n.colours = 500,
  stops = seq(0, 1, length.out = n.colours),
  na.rm = FALSE,
  group = TRUE,
  bounding.aes = NULL
)

scale_fill_y_stepsn(
  ...,
  n.colours = 500,
  stops = seq(0, 1, length.out = n.colours),
  na.rm = FALSE,
  group = TRUE,
  bounding.aes = NULL
)

scale_fill_x_viridis_c(
  ...,
  n.colours = 500,
  stops = seq(0, 1, length.out = n.colours),
  na.rm = FALSE,
  group = TRUE,
  bounding.aes = NULL
)

scale_fill_y_viridis_c(
  ...,
  n.colours = 500,
  stops = seq(0, 1, length.out = n.colours),
  na.rm = FALSE,
  group = TRUE,
  bounding.aes = NULL
)

scale_fill_x_viridis_b(
  ...,
  n.colours = 500,
  stops = seq(0, 1, length.out = n.colours),
  na.rm = FALSE,
  group = TRUE,
  bounding.aes = NULL
)

scale_fill_y_viridis_b(
  ...,
  n.colours = 500,
  stops = seq(0, 1, length.out = n.colours),
  na.rm = FALSE,
  group = TRUE,
  bounding.aes = NULL
)
Arguments
- ...
Additional parameters passed on to the scale type
- type
One of the following:
"gradient" (the default)
"viridis"
A function that returns a continuous colour scale.
- n.colours
Number of colours for the gradient to transition between.
- stops
Locations of the gradient colours between the start and end points of the gradient (as a proportion of the distance from the start point to the end point).
- na.rm
If
FALSE, the default, missing values are removed with a warning. IfTRUE, missing values are silently removed.- group
A logical indicating whether the gradient or pattern is relative to the bounding box of the grob or whether it is relative to individual shapes within the grob.
- bounding.aes
Character vector of position aesthetics for guessing bounding boxes. See Details.
Details
These scales use information from their respective positional scales,
so any x or y scale variants should be added to the plot beforehand.
Bounding ranges of grobs or shapes are guessed based on the data values of
the aesthetics of the positional scale, with the exception that if lower,
upper, xlower or xupper are present, no other aesthetics are used.
This can be overridden by specifying bounding.aes. See examples.
Does not yet work for geom_point() and similar geometries, including
geom_label(), or for non-linear coordinate systems.
Examples
library(ggplot2)
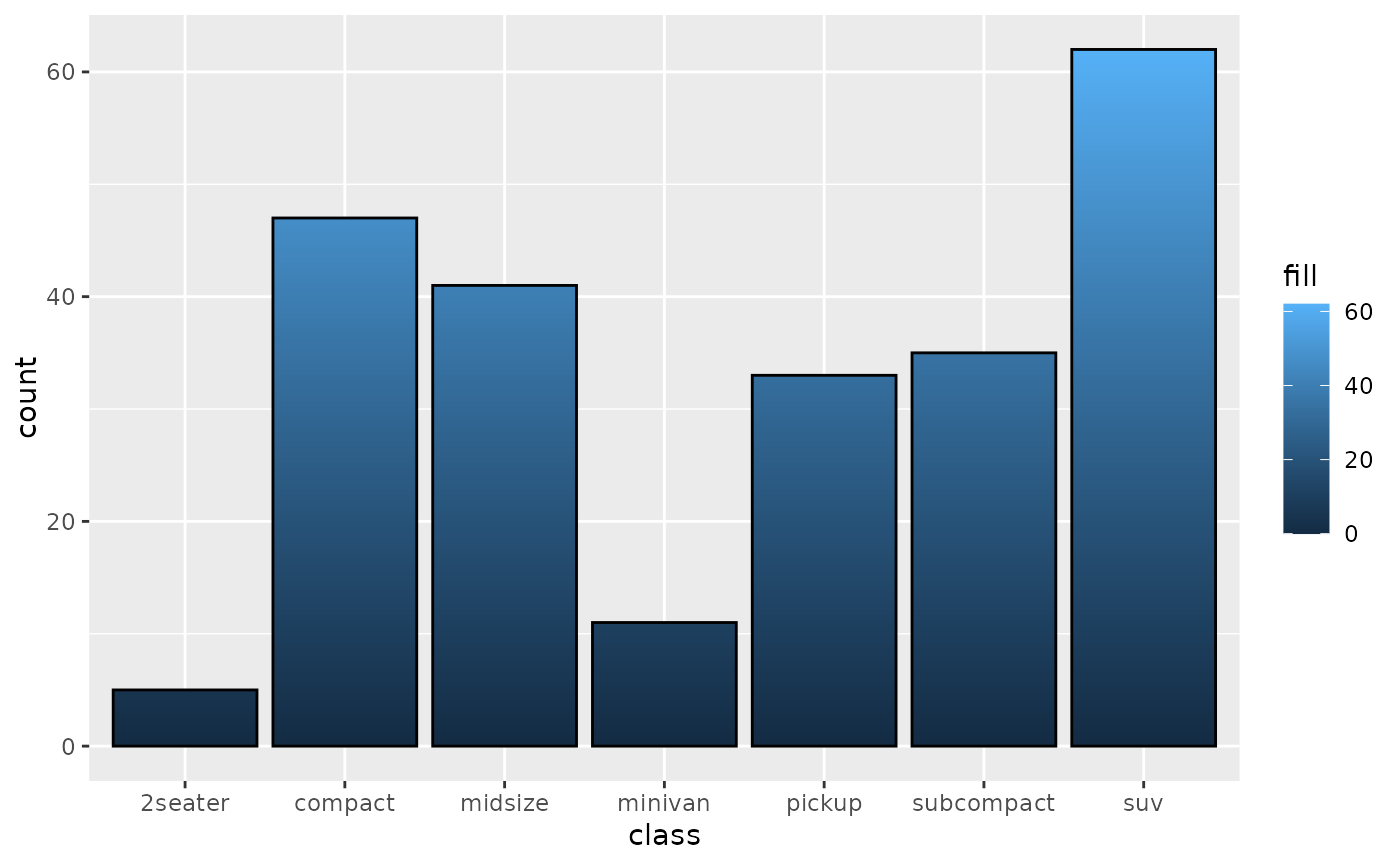
ggplot(mpg, aes(class, fill = 1)) +
geom_bar(colour = "black") +
scale_fill_y()
 # set aes(fill) only for geoms to be affected
p <- ggplot(mpg, aes(displ, hwy)) +
geom_smooth(aes(fill = 1), alpha = 1) +
geom_point()
p + scale_fill_x_viridis_b()
#> `geom_smooth()` using method = 'loess' and formula = 'y ~ x'
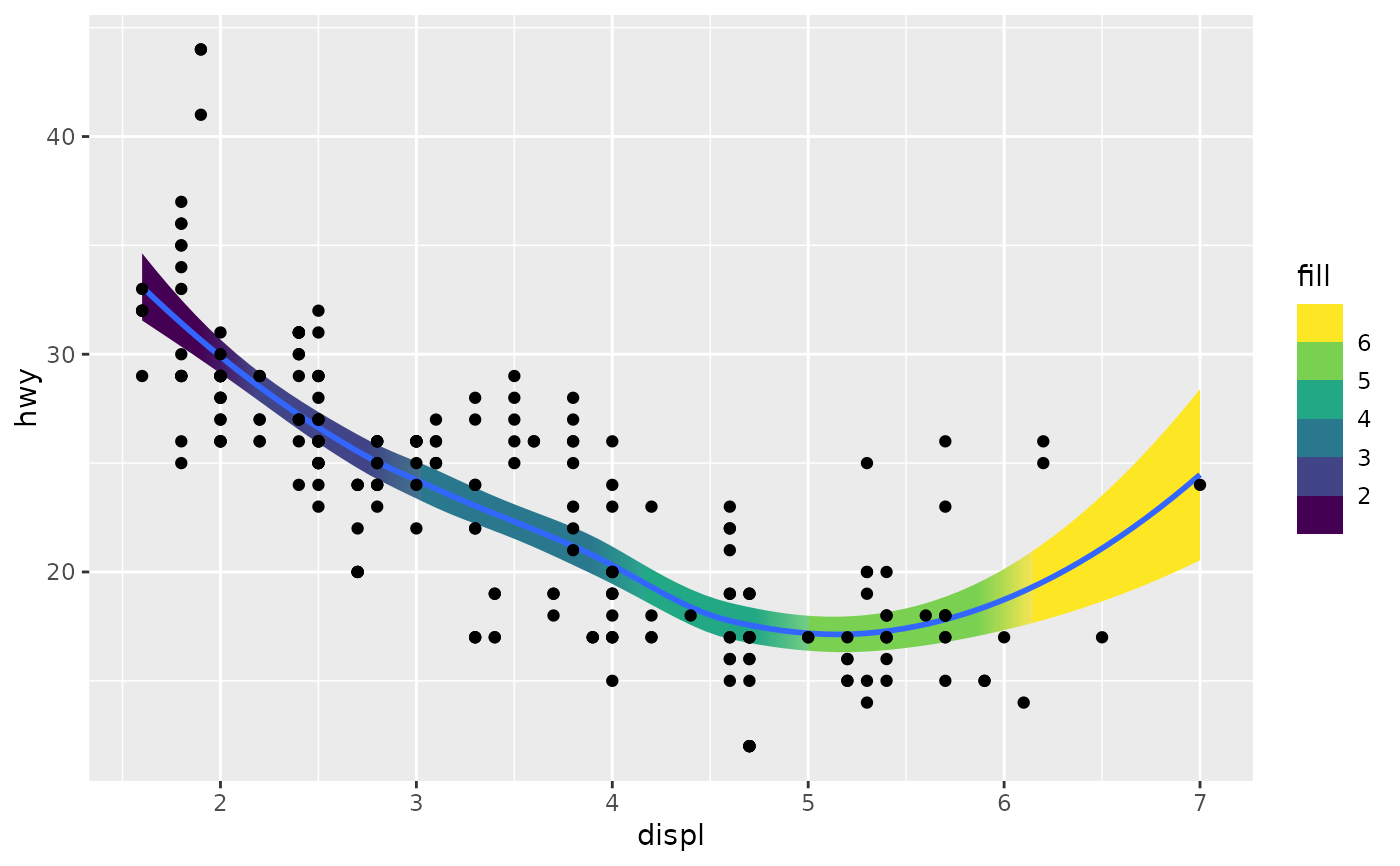
# set aes(fill) only for geoms to be affected
p <- ggplot(mpg, aes(displ, hwy)) +
geom_smooth(aes(fill = 1), alpha = 1) +
geom_point()
p + scale_fill_x_viridis_b()
#> `geom_smooth()` using method = 'loess' and formula = 'y ~ x'
 p + scale_fill_x_viridis_b(n.colours = 20) # set resolution
#> `geom_smooth()` using method = 'loess' and formula = 'y ~ x'
p + scale_fill_x_viridis_b(n.colours = 20) # set resolution
#> `geom_smooth()` using method = 'loess' and formula = 'y ~ x'
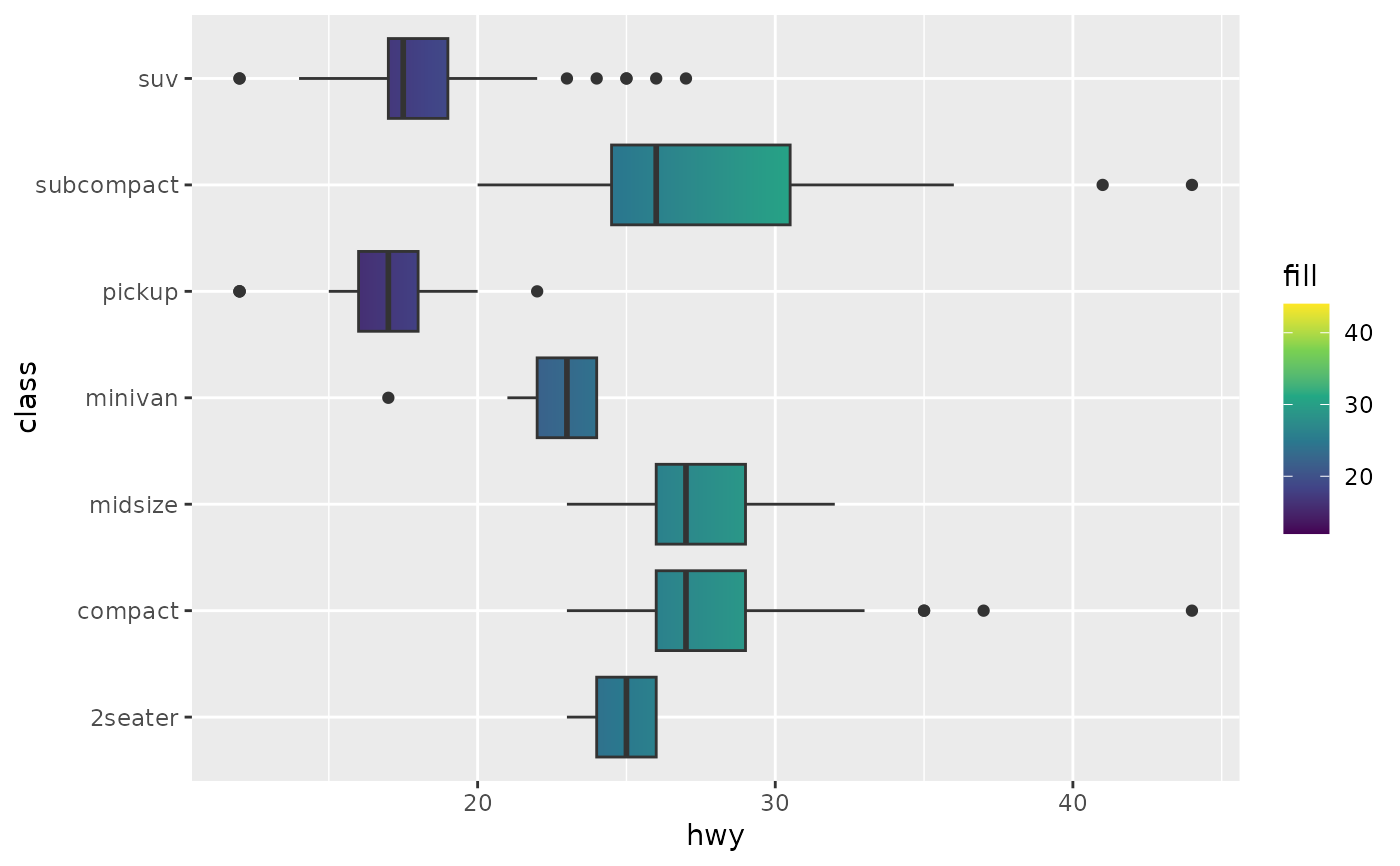
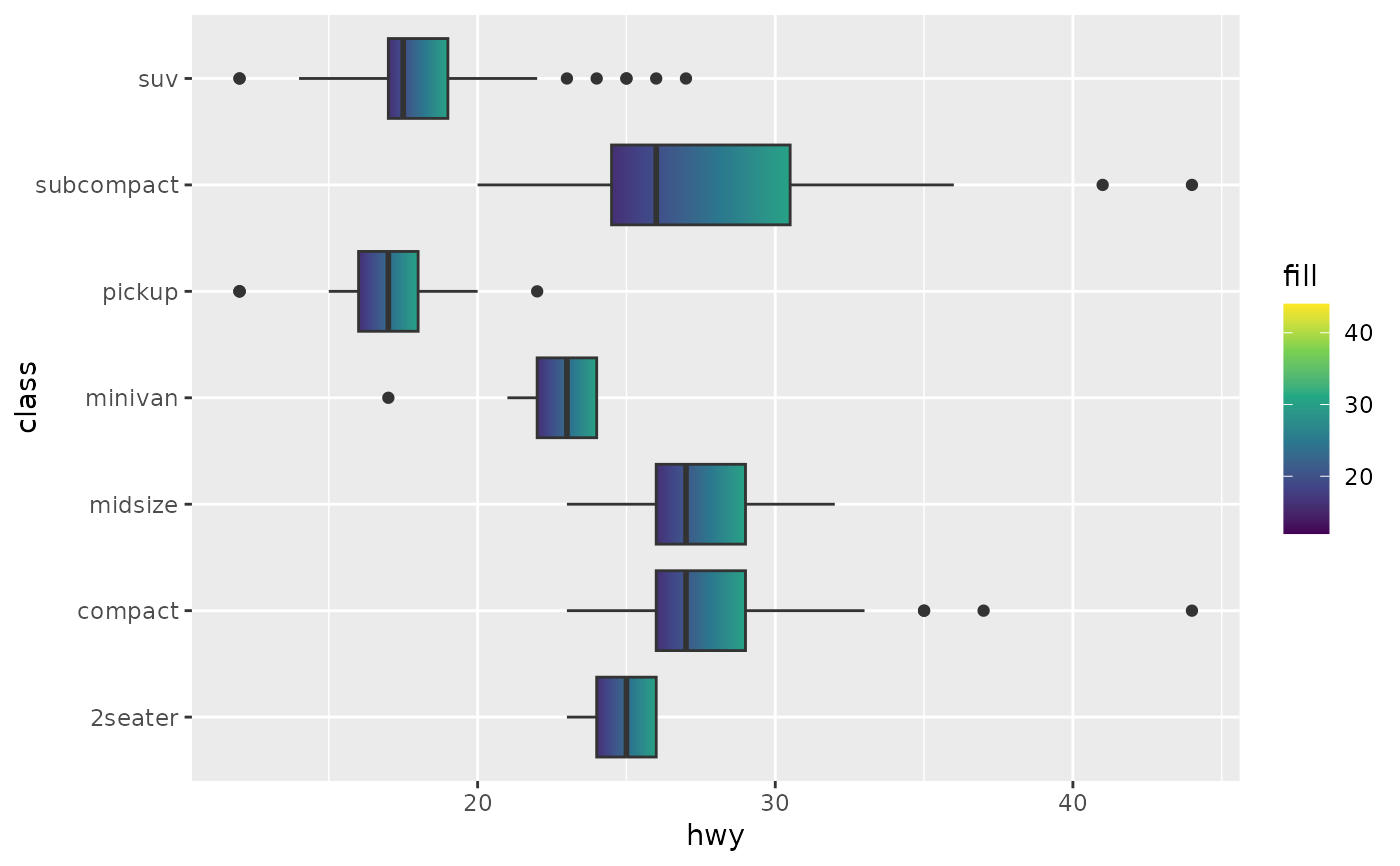
 g <- ggplot(mpg, aes(hwy, class, fill = 1))
b <- g + geom_boxplot()
# some geoms require group = FALSE
b + scale_fill_x_viridis_c(group = FALSE)
g <- ggplot(mpg, aes(hwy, class, fill = 1))
b <- g + geom_boxplot()
# some geoms require group = FALSE
b + scale_fill_x_viridis_c(group = FALSE)
 b + scale_fill_x_viridis_c(group = TRUE)
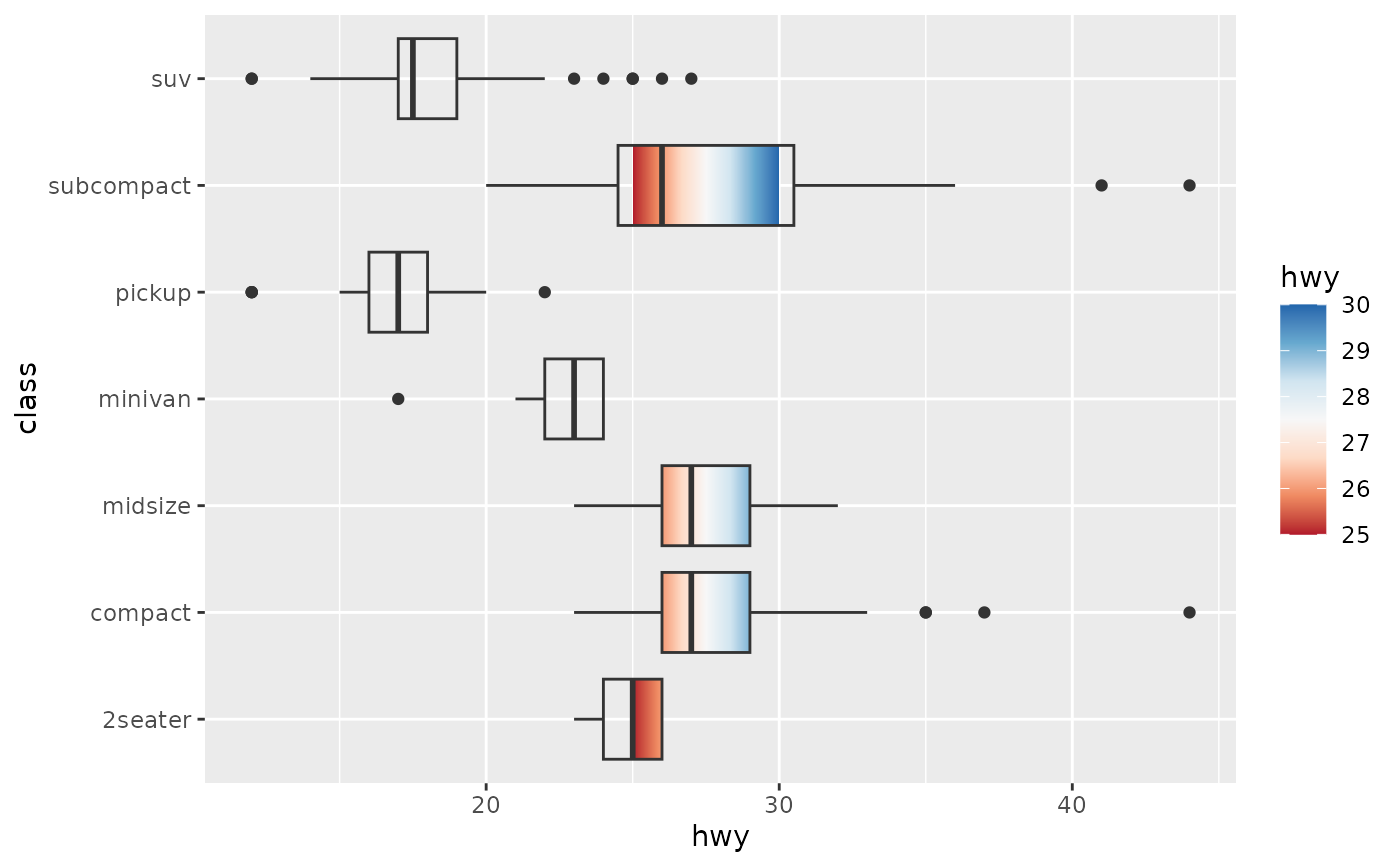
 # use scale_fill_x|y_*() as you would scale_fill_*()
b +
scale_fill_x_distiller(
name = "hwy",
limits = c(25, 30),
na.value = NA,
palette = "RdBu",
direction = 1,
group = FALSE
)
# use scale_fill_x|y_*() as you would scale_fill_*()
b +
scale_fill_x_distiller(
name = "hwy",
limits = c(25, 30),
na.value = NA,
palette = "RdBu",
direction = 1,
group = FALSE
)
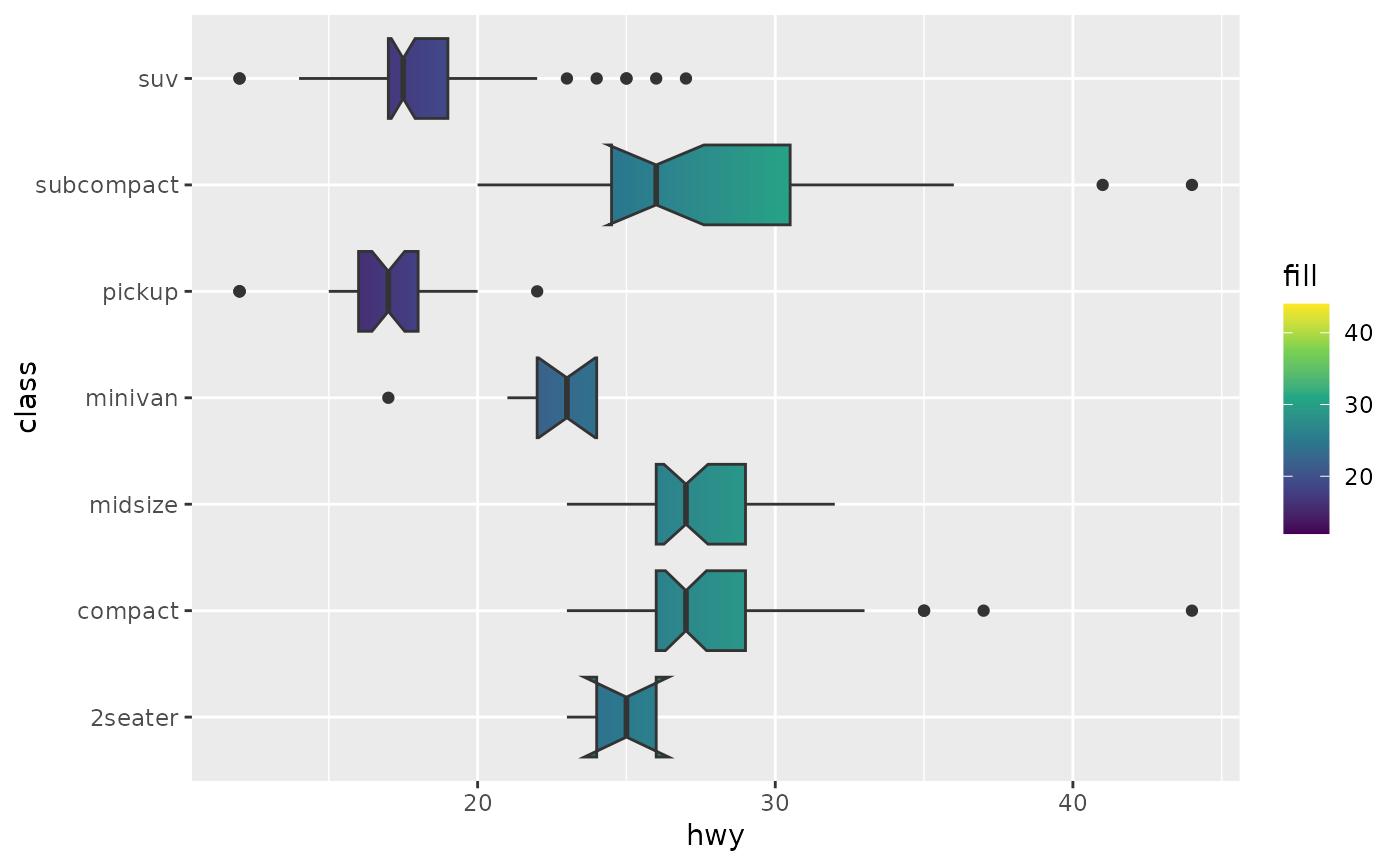
 # notchupper and notchlower are not recognised as positional aesthetics,
# so must be specified if notches exceed the range of their hinges.
# see the documentation for the computed variables of stat_boxplot()
g + geom_boxplot(notch = TRUE) +
scale_fill_x_viridis_c(group = FALSE, bounding.aes = c(
"xlower", "xupper", "notchlower", "notchupper"
))
#> Notch went outside hinges
#> ℹ Do you want `notch = FALSE`?
#> Notch went outside hinges
#> ℹ Do you want `notch = FALSE`?
# notchupper and notchlower are not recognised as positional aesthetics,
# so must be specified if notches exceed the range of their hinges.
# see the documentation for the computed variables of stat_boxplot()
g + geom_boxplot(notch = TRUE) +
scale_fill_x_viridis_c(group = FALSE, bounding.aes = c(
"xlower", "xupper", "notchlower", "notchupper"
))
#> Notch went outside hinges
#> ℹ Do you want `notch = FALSE`?
#> Notch went outside hinges
#> ℹ Do you want `notch = FALSE`?